CONKLIN, Alberta—The challenge of
pulling oil from sand near here has typically required scraping away the boreal forest and underlying peat to expose the tar sand deposits below. The thickened sand is scooped out, then boiled to separate out the bitumen, with the leftover contaminated
water and muck dumped in vast holding ponds the size of small lakes. From orbit the enormous strip mines and tailings lakes created by this process stand out, like a spreading sore—a scar on the planet evidencing the American thirst for oil. But the future of this Canadian province's oil sands leaves less of a visible mark, as can be seen near this town that is not so much a community as an intersection of roads that lead to camps for oil sands workers. That means fewer
strip mines,
tailings lakes and even
giant trucks, but it also means more of the invisible greenhouse gas carbon dioxide accumulating in the atmosphere and warming the planet.
This future is
melting bitumen where it lies at least 200 meters below the surface rather than mining tar sands. In 2011 more than 11,000 barrels of bitumen were melted out of the frozen ground not far from here each day, where the airstrip sees more human traffic than the town as workers commute in and out by plane from as far away as Newfoundland.
"Most of what's going on happens 375 meters below the surface," says Greg Fagnan, director of operations and production at Cenovus's Christina Lake oil sands production facility, during a recent tour. Cenovus extracts bitumen by employing a technique called
steam-assisted gravity drainage, which can be thought of as the opposite of mining. Instead of melting the bitumen out of sand in an industrial plant after clawing the tar sands out of the ground, Cenovus melts it out in place with steam. That means Christina Lake is, in a sense, a giant water-processing facility "that happens to produce oil," Fagnan says. "It's not a complicated business, it's just complex."
Conklin is one of the frontier towns of a new tar sands boom, given that 80 percent of the at least 170 billion barrels in the Canadian province's
tar sands are only accessible this way rather than by mining. In 2011, for the first time, oil production from such in situ operations surpassed that of mining for oil in the tar sands—a trend that is only likely to increase as more oil sands production comes online in Canada. Already, plumes of steam billow from the boreal forest across northeastern Alberta where a host of developers work—from Nexen, recently acquired by the China National Offshore Oil Corp. (CNOOC), to oil majors such as Royal Dutch Shell—like mushrooms springing up from the ground after rain.
But this recovery of bitumen in place will have to continue to improve its efficiency and cost if it is going to compete with other fast-growing oil recovery technologies, such as fracturing rock with high-pressure water, or
fracking, to release trapped oil. As it stands, Alberta is estimated to hold more than 400 billion barrels of such "tight oil," which is already being produced in places like North Dakota's Bakken Shale by the number-one customer for Canada's tar sands oil: the U.S.
Melting tarSteam dominates the Christina Lake facility, where mushroom clouds rise into the wintry blue sky, pierced only by the orange glow of a flare near the bitumen processing plant. Nine industrial boilers, powered by natural gas, heat treated brine from nearby aquifers to 350-degree-Celsius to inject it as steam into what can be likened to three giant, underground sandboxes—vast rectangular blocks of
oil-bearing sand. Each sandbox is pierced by pairs of pipes, one perforated to release pressurized steam along its 800-meter length and melt oil from the tar sands, another to suck melted bitumen, bits of sand, water and natural gas with electric pumps back up to the surface. The pipes are strung with sensors, gauges and fiber
optics, or "jewelry" in the industry jargon, that allow well operators back at the surface to continually monitor conditions under the earth, such as the steam pressure that starts out at a crushing 120-kilogram-force per square centimeter. Christina Lake pumps out a barrel of oil for every 2.3 barrels of injected steam.
Cenovus claims to use just 0.07 barrel of freshwater to produce each barrel of oil at Christina Lake, thanks to the recycling and almost exclusive use of brackish waters. According to the Royal Society of Canada's
2010 report on such tar sandsdevelopment, a typical facility uses 0.6 barrel of freshwater and 0.4 barrel of brine per barrel of oil. "Conventional oil from the Saudis uses more water than the [steam-assisted gravity drainage] process," says geologist John Zhou, executive director of environmental management at Alberta Innovates, a government-funded technology innovation effort.
Drilling the wells themselves presents the first challenge. During installation, the pairs of wells in each sandbox site are drilled simultaneously, rigorously maintaining a spacing of only five meters apart, with a rig specially modified for this kind of oil sands exploitation. At each site, or well pad, roughly eight such wells are drilled,
lining up side by side—on one side eight or more steam injectors and on the other a matched number of oil-producing wells.
After a few years of production, such as at Cenovus's older Foster Creek facility started up in 2001, additional wells are drilled to recover oil from the wedges of tar sand between each steam-created balloon-shaped melt zone. Such
wedge wells have enabled Cenovus to add 20,000 barrels of production per day to Foster Creek without requiring any additional steam—and a given well is expected to produce for roughly 20 years, though no well is yet that old.
"These fields are really like laboratories," says Cenovus spokesman Brett Harris, and operators are making continual adjustments and suggesting improvements, such as pumps that can withstand the high temperatures underground but also run on electricity rather than natural gas. Operators are also constantly adjusting the flow of steam, closing off sections of the perforated pipe to shut off heat to certain sections and ensure even melting throughout. Such in situ production has always been experimental, starting with the first attempt back in 1926: The pipes available at the time could not withstand the steam's heat and pressure, resulting in a steam explosion that destroyed the start-up plant and injuries to entrepreneur
Jacob Owen Absher, among others.
That is not a problem that has entirely disappeared. Oil company Devon Canada actually used too much pressure on its subterranean sandbox and
caused a blowoutthat shot scalding steam and bitumen into the sky in the summer of 2010 near here, and Total Energy caused a similar explosion of steam, oil and rock north of Fort McMurray in 2006. The steam pipelines themselves have also blown as a result of cooled water trapped inside. Such a "water hammer" has tossed pipelines as much as a kilometer, Cenovus's Fagnan says, leaving them sticking out of the ground like toothpicks embedded more than three meters deep. The steam "packs a pretty big punch," he says.
Better engineeringThe engineering challenges faced by in situ projects range from a lack of a sufficient seal above the oil sands deposit—allowing steam to escape without melting oil or, even worse, the oil itself to flow away—to underlying aquifers, or "thief zones," that can quench barrel after barrel of steam heat. And that's after the expensive well pairs have been put in place. At
Christina Lake the reservoir sits below a layer not of rock, but of natural gas—and that means Cenovus operators must continually inject air to ensure that the gas pressure matches or exceeds the pressure of the pumped in steam, so the steam doesn't escape without doing its melting work.
The ultimate engineering challenge of the tar sands, however, may be
coping with greenhouse gases. As a result of increasing in situ production, greenhouse gas emissions from Alberta's tar sands rose by 1.7 percent last year, and are up 16 percent since 2009, according to the Canadian Association of Petroleum Producers. The newly dominant in situ technology produces oil at a cost of 2.5 times more CO2 emitted to the atmosphere than the more brute-force, conventional mining. Whereas this may be equivalent to what's emitted when using steam to flood out heavy oils in California or Nigeria, neither of those sources of greenhouse gases is growing as fast as the tar sands.
In an effort to get ahead of this climate challenge, Alberta has invested more than $1.5 billion in developing
CO2 capture and storage (CCS) technology. But it has yet to be applied to an in situ operation; the one current project in the oil sands involves capturing CO2 emissions from mini-refineries at Shell's operation near Fort Saskatchewan, a project dubbed Quest. That project is slated to open in 2015 and there are, as yet, no plans for CO2 capture and storage at any in situ facilities.
The Pembina Institute, a Canadian environmental group, estimates that it would cost more than $200 per metric ton of CO2 to
add CCS to tar sands production facilities like Christina Lake. Alberta's current price on CO2 is $15 per metric ton. "The trick is to find a way to make capture and storage economic," Harris says, noting that Cenovus has done exactly that at its Weyburn
enhanced oil recovery project in Saskatchewan. The company uses CO2 captured at a gasification plant across the border in North Dakota to scour more oil out of the ground—and the extra oil produced helps pay for the CO2 capture process, although the oil also ends up contributing to the growing greenhouse gas burden when burned.
Reducing energy use, then, may prove a better route. By using solvents, such as the hydrocarbon butane, in situ producers can boost the bitumen recovery ability of the steam itself. Cenovus has been testing the process at Christina Lake since 2004 and will implement it at the company's newly approved Narrows Lake project, slated to start producing oil in 2017. Using such solvents "can drop the energy consumption by as much as 50 percent," says chemical engineer Murray Gray, scientific director of the Center for Oil Sands Innovation at the University of Alberta.
Such new technology means more cost to develop and produce what is already among the most costly forms of oil, Gray notes. At present, Cenovus spokesman Harris says that the company needs to earn at least $35 per barrel of oil. With West Texas Intermediate grade oil at $85, that is not a problem, except for the atmospheric warming. And it's not as if in situ development has
no impact on the land: there's the industrial plant for producing steam and processing bitumen, tank farms to hold the final product, and big, boxy clearings for well pads kitted out with machinery like an elongated caterpillar with wells for legs that also connects to multiple pipelines snaking through the boreal forest. So do row after row of
clear-cut lines for the seismic testingthat reveals where the tar sand deposits lie, cuts that take a long time to heal given the slow growth rate of trees this far north.
But the technology for melting bitumen out of the ground is still developing. The first commercial steam-assisted gravity drainage facility only started up in 2001. Already experiments have started with potential advances such as microwaving the ground to loosen the oil, as attempted in tests by U.S. defense contractor Harris Corp. this year. "This industry is so young," says Scott Wenger, manager of government relations at original oil sands company Suncor, which hosted Harris's electromagnetic sand-heating effort. "Who knows what will happen with new technology?"
 During the first trimester, we devoted an entire chapter to the study and discussion of natural resources. We learned about resources utilized today along with efforts to wisely use those same resources and preserve them for future generations.
 If you remember Chapter 4 (the natural resources chapter), we discussed the tar sand sands in Canada and other locales. Included in the discussion (as we did for all natural energy resources) were the pro's and con's of each. Greenhouse gas emissions and serious site degradation were two big con's.
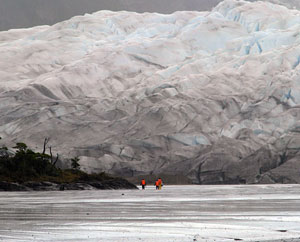
  MELTING TAR: A production well, like the one pictured here at Cenovus's Christina Lake facility, sucks bitumen melted by steam out of the ground--an alternative to strip mining for tar sands.Image: © David Biello